Before I dive into Grafana I wanted to make a quick note that last week marked my 1 year anniversary at NetApp. This year has honestly flown by and it is hard to believe as it feels like just yesterday I started this new adventure with various unknowns. It has been a year full of change along with many new experiences which I feel have made me stronger, both as an individual and professional. I am thankful for the opportunity at NetApp and for the ability to work with so many great customers that have turned to us to solve their most critical of IT issues. I look forward to the challenges that lay ahead and for many more years with this great team at NetApp.
With that being said that I think it is now time to discuss Grafana. Grafana is an open source graphing application that integrates with applications such as Graphite. If you read my previous blog post on OPM’s new external data relay capabilities, you would know that one of the applications you can send data to is Graphite. While you can create custom dashboards within Graphite, the interface leaves much to be desired from both an aesthetic and functional point of view - this is where Grafana comes in. Grafana has a much more refined interface that presents the ability to create advanced dashboards from several different data sources. Grafana also contains a powerful query editor that allows you to filter data using patterns to ensure only the proper data is illustrated. Below I have created a step by step tutorial on how to stand up a Grafana/InfluxDB instance on an existing Graphite server running CentOS 6.6. If you run into any issues or have any feedback at all regarding the content please feel free to leave a comment below.
- Prepare Apache for the Grafana installation and configuration
Edit the “/etc/httpd/conf/httpd.conf” file and add the following line of text below the “Listen 80” line to ensure Apache listens on port 8080:
Listen 8080Also add the following lines right after the “Include conf.d/*.conf” line to the aforementioned file to prepare Apache for Grafana (replace ‘10.26.69.144’ with the IP address of your Grafana server)
# Added for Grafana
<VirtualHost *:80>
 ServerName 10.26.69.144
 ServerAlias 10.26.69.144
 Redirect permanent / http://10.26.69.144:3000/
</VirtualHost>
Edit the “/etc/httpd/conf.d/graphite-web.conf” file and make the appropriate changes to the “<Virtual Host *” line
<VirtualHost *:8080>Restart Apache to apply the recent configuration changes
/etc/init.d/httpd restart
- Install and configure InfluxDB which will serve as a backend for Grafana
Download the latest version of the InfluxDB RPM
wget https://s3.amazonaws.com/influxdb/influxdb-0.8.8-1.x86_64.rpmInstall the InfluxDB RPM package
rpm -ivh influxdb-0.8.8-1.x86_64Enable InfluxDB to start at boot
ln -s /opt/influxdb/current/scripts/init.sh /etc/init.d/influxdb
chkconfig influxdb on
Ensure that InfluxDB is started (if not start it)
/etc/init.d/influxdb status
/etc/init.d/influxdb start
Login to the InfluxDB management URL which can be accessed by browsing to http://<server_ip_address>:8083
Once you are logged in using the default username & password of “root”, create a database named “dashboards”
Next you will want to click the database name and then create a new admin database user named “grafana”. Please ensure that you are recording the passwords specified in the recent steps as you will need these in the coming steps.
Reset the “root” user password by browsing to “Cluster Admins” -> root, entering a new password twice, and then clicking “Change Password”.
- Install and configure Grafana
Download the latest version of Grafana
cd ~
wget http://grafanarel.s3.amazonaws.com/builds/grafana-2.1.0-pre1.x86_64.rpm
Install Grafana by installing the the recently downloaded RPM file
rpm -ivh grafana-2.1.0-pre1.x86_64.rpmEnsure you can access the Grafana web interface by browsing to http://<server_ip_address>
Create your graphite data source by clicking “Data Sources” and then “Add new”. Ensure to fill out the fields as follows and then click “Add”:
Name: graphite
Default: checked
Type: Graphite
HTTP settings
Url: http://<server_ip_address>:8080
Access: direct
- Verify Grafana is operating properly and create a basic dashboard
- With the Grafana web interface still up click “Home” in the upper right hand corner
- Under “Load dashboard from Graphite-Web” select “graphite” for the data source field and click “List dashboards” under and ensure that no errors get returned (Hint no results will be returned)
- Once you have verified the graphite data source is working properly click on “Dashboards” on the left side of the screen (under the Grafana logo)
- You can then create a new dashboard by clicking on “Home” and then “New”
- Create a basic graph by hovering over the green vertical rectangle and by selecting “Add Panel” -> “Graph”
- Edit the graph by clicking the title and selecting “edit”
- Give the graph a name by selecting the “General” tab and by specifying a custom name in the “Title” text field
- Next you will select “Metrics” -> “graphite” -> “graphite" to ensure that the proper data source is utilized for this graph
- Specify a metric by clicking “select metric” -> netapp-performance -> “select metric” -> Clusters -> “select metric” -> <cluster_name> -> “select metric” -> SVMs -> “select metric” -> <svm_name> -> “select metric” -> Volumes -> “select metric” -> * -> TOTAL_OPS
- Once you are done customizing this graph you can add more (or quit) by pressing the “Back to dashboard” button at the top of the page
- You should now see the recently created graph on your dashboard however you will need to save your changes. You can do this by clicking the floppy disk icon (at the top of the page) -> specifying a dashboard name in the text field -> clicking the floppy disk icon to the right of the text field.
- If you wanted to set aforementioned dashboard as the default you can click the floppy disk icon (at the top of the page) -> “Save as Home”
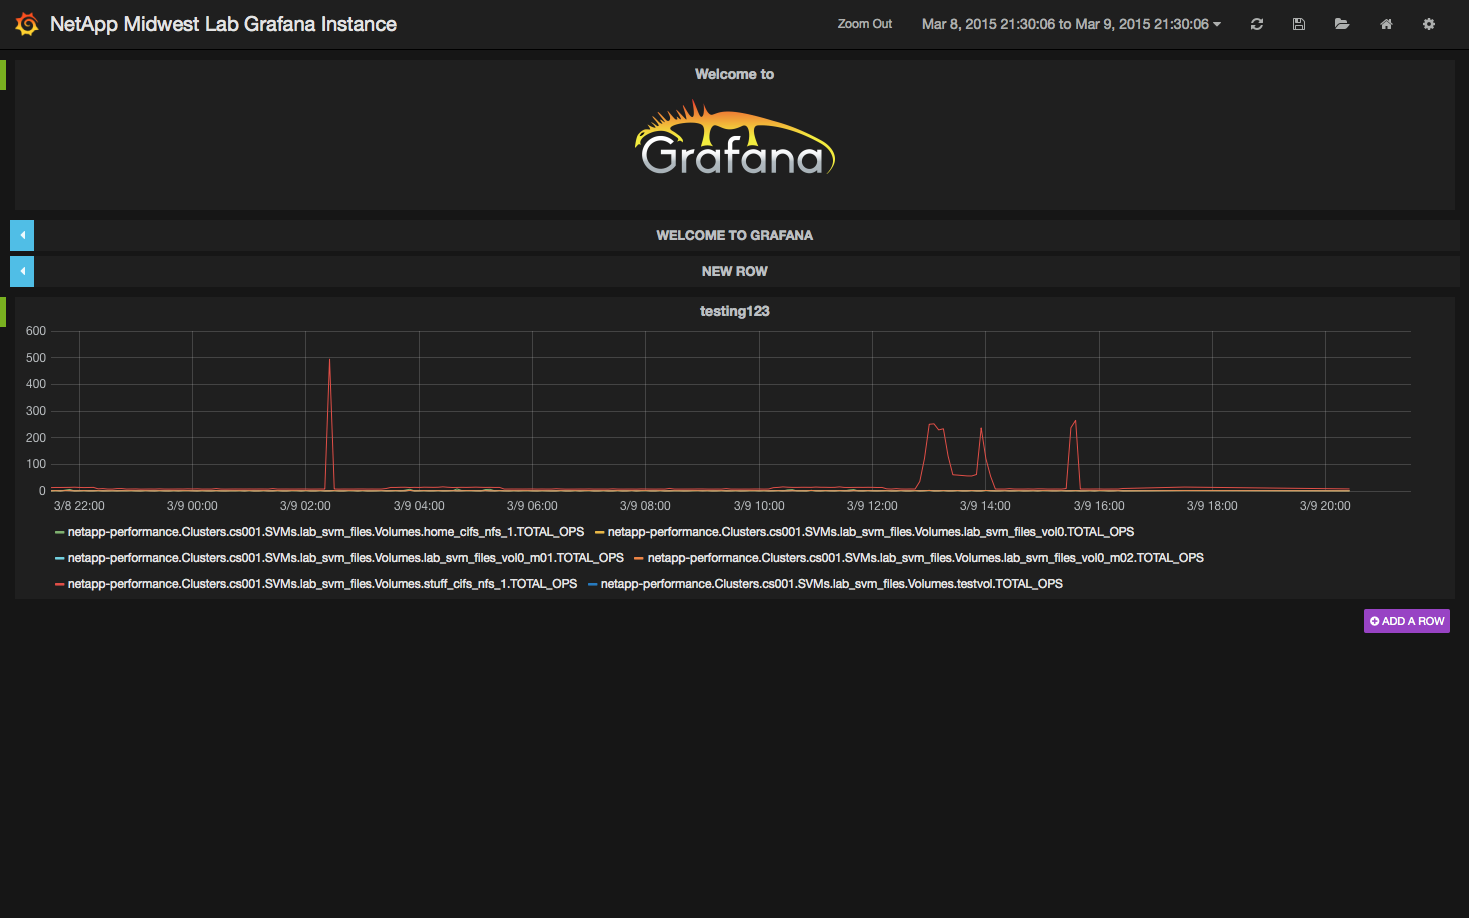
- Your end result will look something like this:
For more details please refer to the following links:
UPDATED on 2015-07-13: This guide was updated to not only incorporate the new steps required to install Grafana 2.1 using the prebuilt RPM but also to follow along with the new interface layout.