As you may well know OnCommand Performance Manager 1.1RC1 was recently released which added the ability to send data to an external system such as Graphite. I have created the following tutorial which explains how to setup a CentOS server and install the Graphite application on it. If you run into any issues with the tutorial please let me know in the comment section below.
- Provision a CentOS 6+ VM with the “Base” package group installed
- Install the “EPEL” mirror on the system
rpm -ivh http://dl.fedoraproject.org/pub/epel/6/x86_64/epel-release-6-8.noarch.rpm
- Install the appropriate RPM packages
yum install graphite-web graphite-web-selinux mysql mysql-server MySQL-python python-carbon -y
- Start MySQL and enable the service to start at boot
/etc/init.d/mysqld start
chkconfig mysqld on
- Execute the “mysql_secure_installation” script and accept the defaults
mysql_secure_installation
- Add the following lines underneath the “Database Configuration” section of the “/etc/graphite-web/local_settings.py” config file
DATABASES = { 'default': { 'NAME': 'graphite', 'ENGINE': 'django.db.backends.mysql', 'USER': 'graphite', 'PASSWORD': 'netapp1-', 'HOST': 'localhost', 'PORT': '3306' } } - Create the “graphite” MySQL user along with the appropriate permission entries
mysql -e "CREATE USER 'graphite'@'localhost' IDENTIFIED BY 'netapp1-';" -u root -p
mysql -e "GRANT ALL PRIVILEGES ON graphite.* TO 'graphite'@'localhost';" -u root -p
mysql -e "CREATE DATABASE graphite;" -u root -p
mysql -e 'FLUSH PRIVILEGES;' -u root -p
- Create the appropriate MySQL database and tables which will be used by graphite
/usr/lib/python2.6/site-packages/graphite/manage.py syncdb
- Change the value for the “MAX_CREATES_PER_MINUTE” setting in the “/etc/carbon/carbon.conf” configuration file
MAX_CREATES_PER_MINUTE = 200
- Add the following lines to the “/etc/carbon/storage-schemas.conf” config file
[OPM]
pattern = ^netapp-performance\..*
retentions = 5m:100d
- Create the “/etc/carbon/storage-aggregation.conf” file with the following content
# Aggregation methods for whisper files. Entries are scanned in order,
# and first match wins. This file is scanned for changes every 60 seconds
#
#  [name]
#  pattern = <regex>
#  xFilesFactor = <float between 0 and 1>
#  aggregationMethod = <average|sum|last|max|min>
#
#  name: Arbitrary unique name for the rule
#  pattern: Regex pattern to match against the metric name
#  xFilesFactor: Ratio of valid data points required for aggregation to the next retention to occur
#  aggregationMethod: function to apply to data points for aggregation
#
[min]
pattern = \.min$
xFilesFactor = 0.1
aggregationMethod = min
[max]
pattern = \.max$
xFilesFactor = 0.1
aggregationMethod = max
[sum]
pattern = \.count$
xFilesFactor = 0
aggregationMethod = sum
[default_average]
pattern = .*
xFilesFactor = 0.5
aggregationMethod = average
- Add the following line to the “/etc/httpd/conf.d/graphite-web.conf” configuration file underneath “Alias /media/”
Alias /content/ "/usr/share/graphite/webapp/content/"
- Fix the following filesystem permission issues
chmod 775 /var/log/graphite-web/
chmod 775 /var/lib/graphite-web/
- Start the “carbon-cache” & “httpd” services and enable them to start at boot
/etc/init.d/carbon-cache start
chkconfig carbon-cache on
/etc/init.d/carbon-aggregator start
chkconfig carbon-aggregator on
/etc/init.d/httpd start
chkconfig httpd on
- Complete the “Configuring a connection from a Performance Manager server to an external data provider” steps outlined in the “OnCommand Performance Manager 1.1 Installation and Administration Guide For VMware Virtual Appliances” document found here. This will enable performance data to be sent from the OPM server to the new graphite server
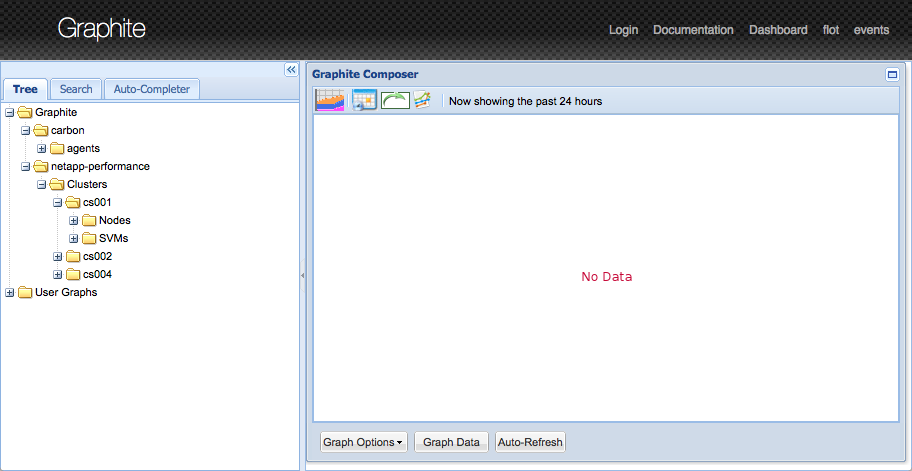
- After waiting 5 or so minutes you should now see all of the appropriate OPM data points within Graphite under the “netapp-performance” folder